
Proof anchor · UAE e-commerce
TyresOnline UAE
TyresOnline UAE: +67% YoY revenue on the same spend profile. Google ROAS 13.95 to 19.48. Meta ROAS 9.77 to 14.32.
Platform results
The receipts
Straight from the ad accounts. Same 3-month window, one year apart.
Nothing adjusted, nothing cherry-picked. Apr 1–Jun 30 2024 versus the same window in 2025, pulled directly from Google Ads and Meta Ads Manager. We report year-over-year so seasonality cannot explain the curve.
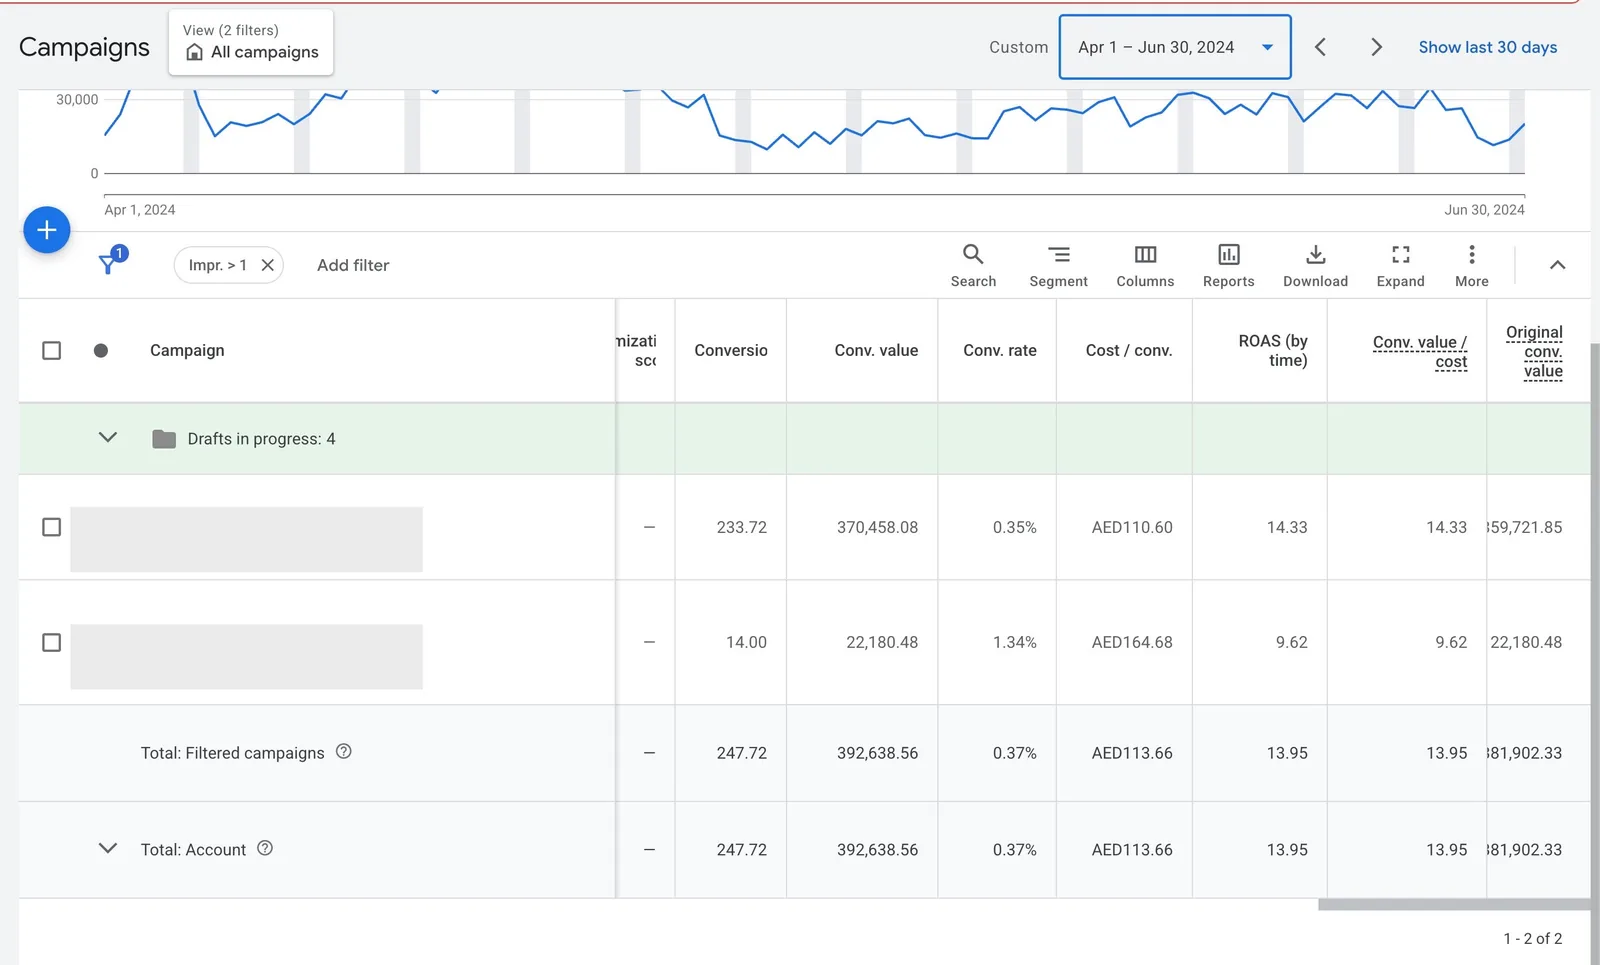
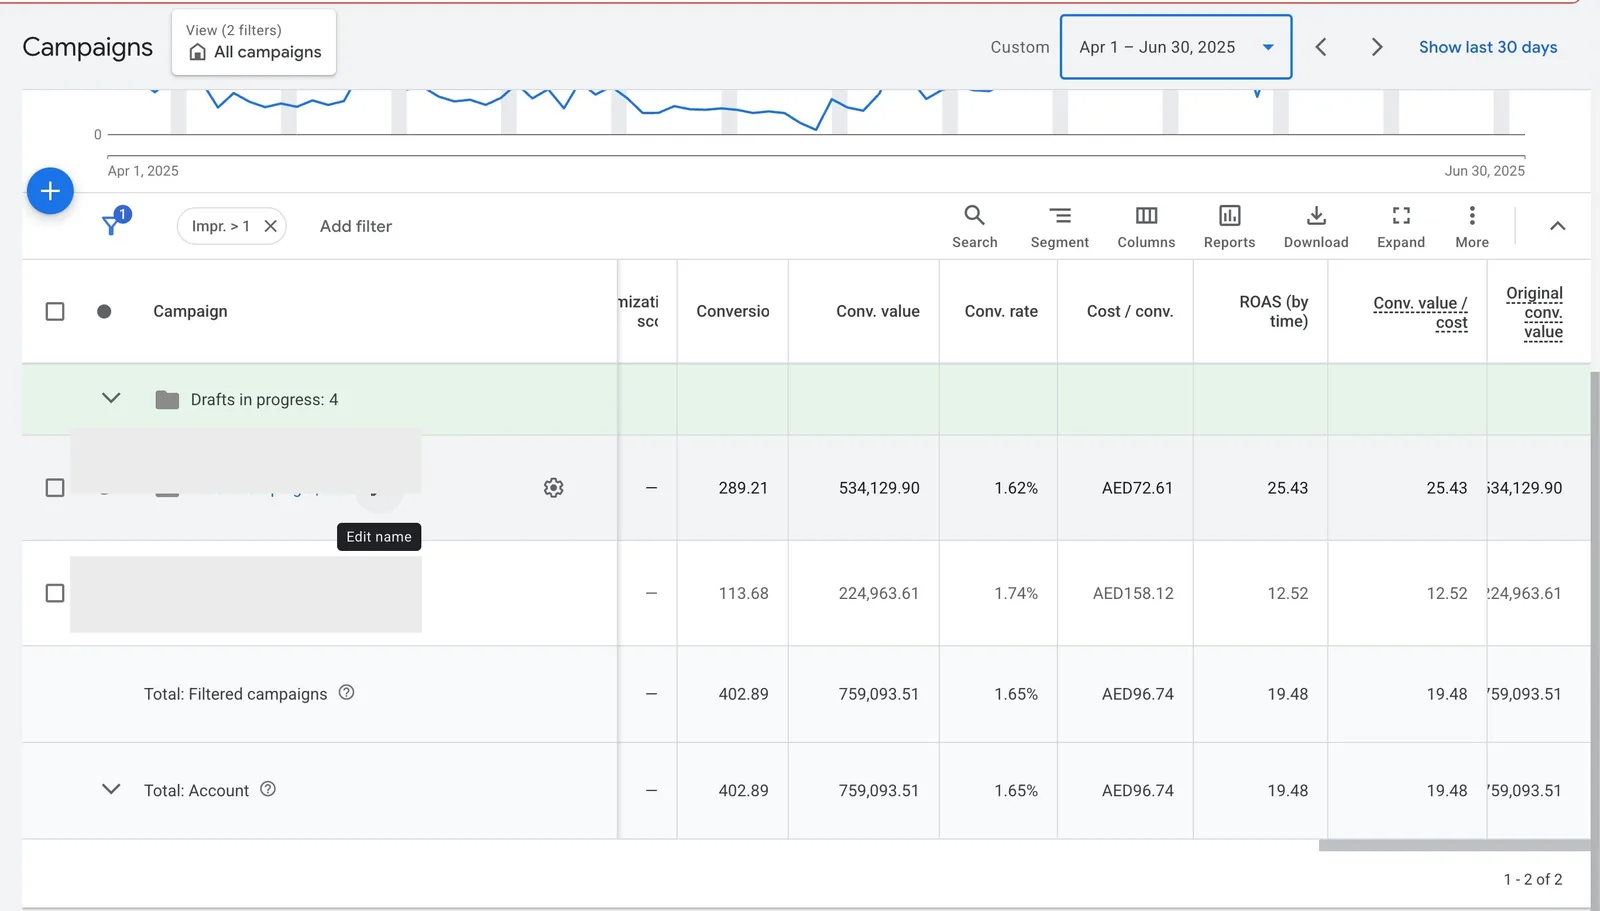
Google Ads, the same quarter one year apart.
ROAS rose from 13.95 to 19.48 and conversion value from AED 392,638 to AED 759,093, while conversion rate climbed from 0.37% to 1.65% — on the same spend profile, once the data layer was rebuilt.
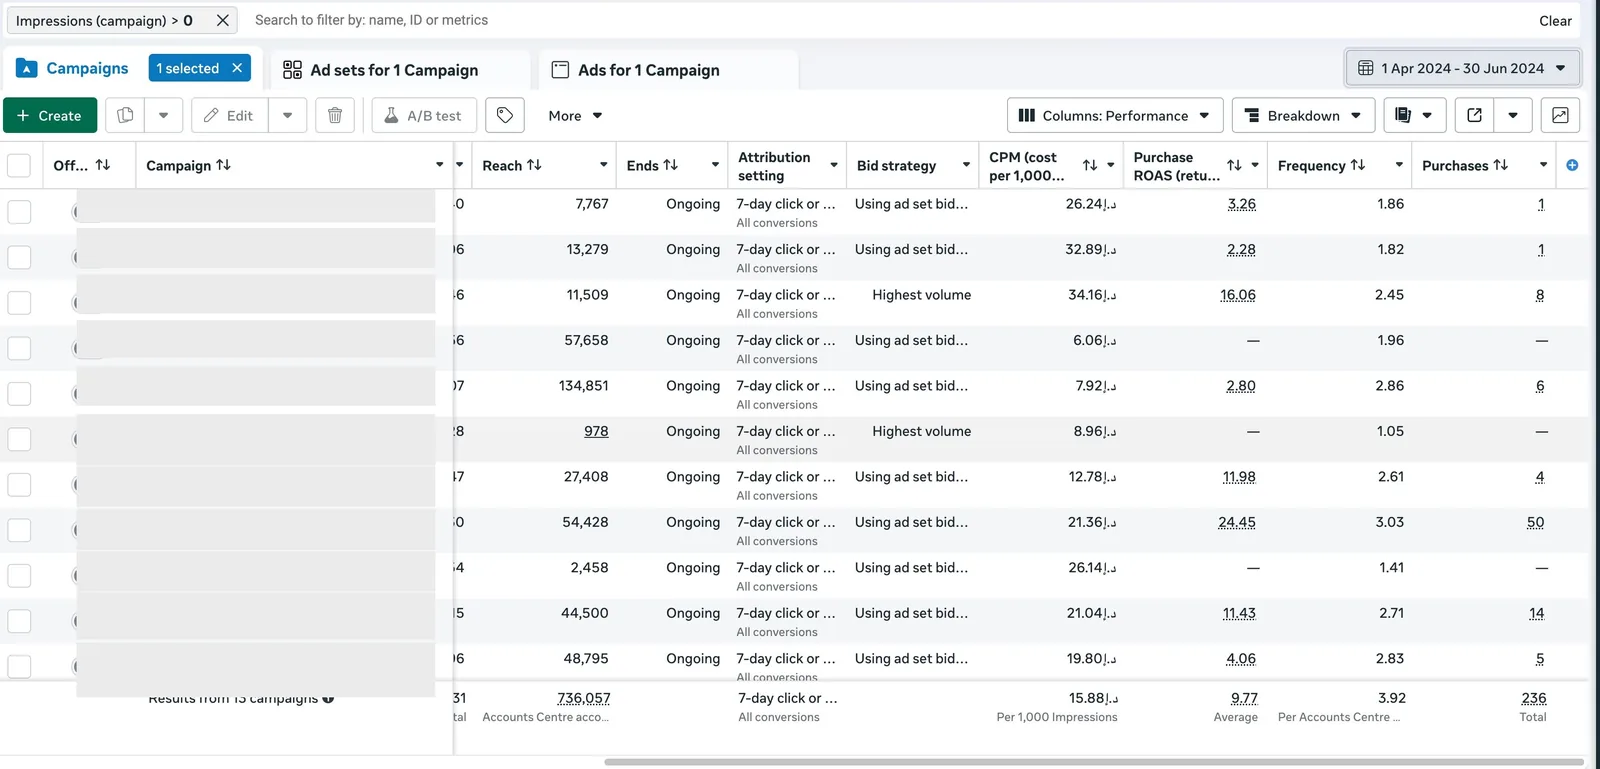
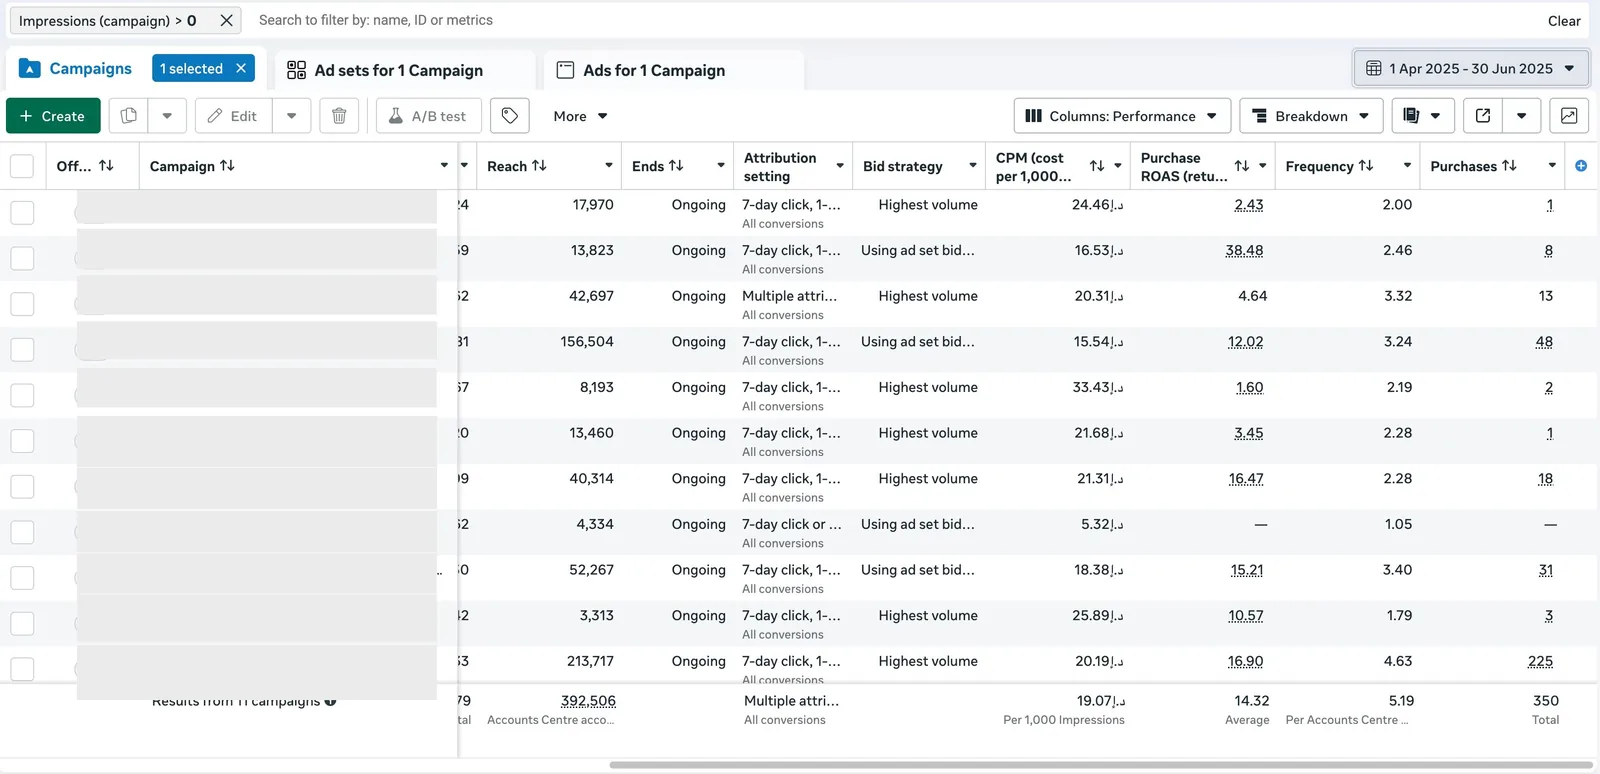
Meta Ads, the same quarter one year apart.
Average purchase ROAS rose from 9.77 to 14.32 once item-level signals were flowing into the catalogue — a +47% lift on the same market and spend profile.
How we did it
The method is not theoretical. Here it is, mapped to the timeline.
Capture
We rebuilt what the last setup never touched. The same spend started hitting clean data instead of noise.
- Data architecture rebuilt via GTM
- Conversion API installed on Meta and Google
- Account structure rebuilt around platform learning
- 7,000+ product segmentation built via Google Scripts
- PMax restructure
Convert
With clean signal underneath, creative and offers could be tested honestly against high-intent segments.
- Creative strategy built on validated data
- Catalogue optimisation on Meta
- Landing page and offer alignment to high-intent segments
Compound
Year-over-year revenue lift on the same market and the same spend profile. We report YoY, not QoQ, so seasonality cannot explain the curve. The last campaign was making the next one cheaper.
Book a call
Same budget. Cleaner foundation.
We'll show you the foundation gap on your account and what the first 60 days would rebuild.